Revenue Performance Dashboard

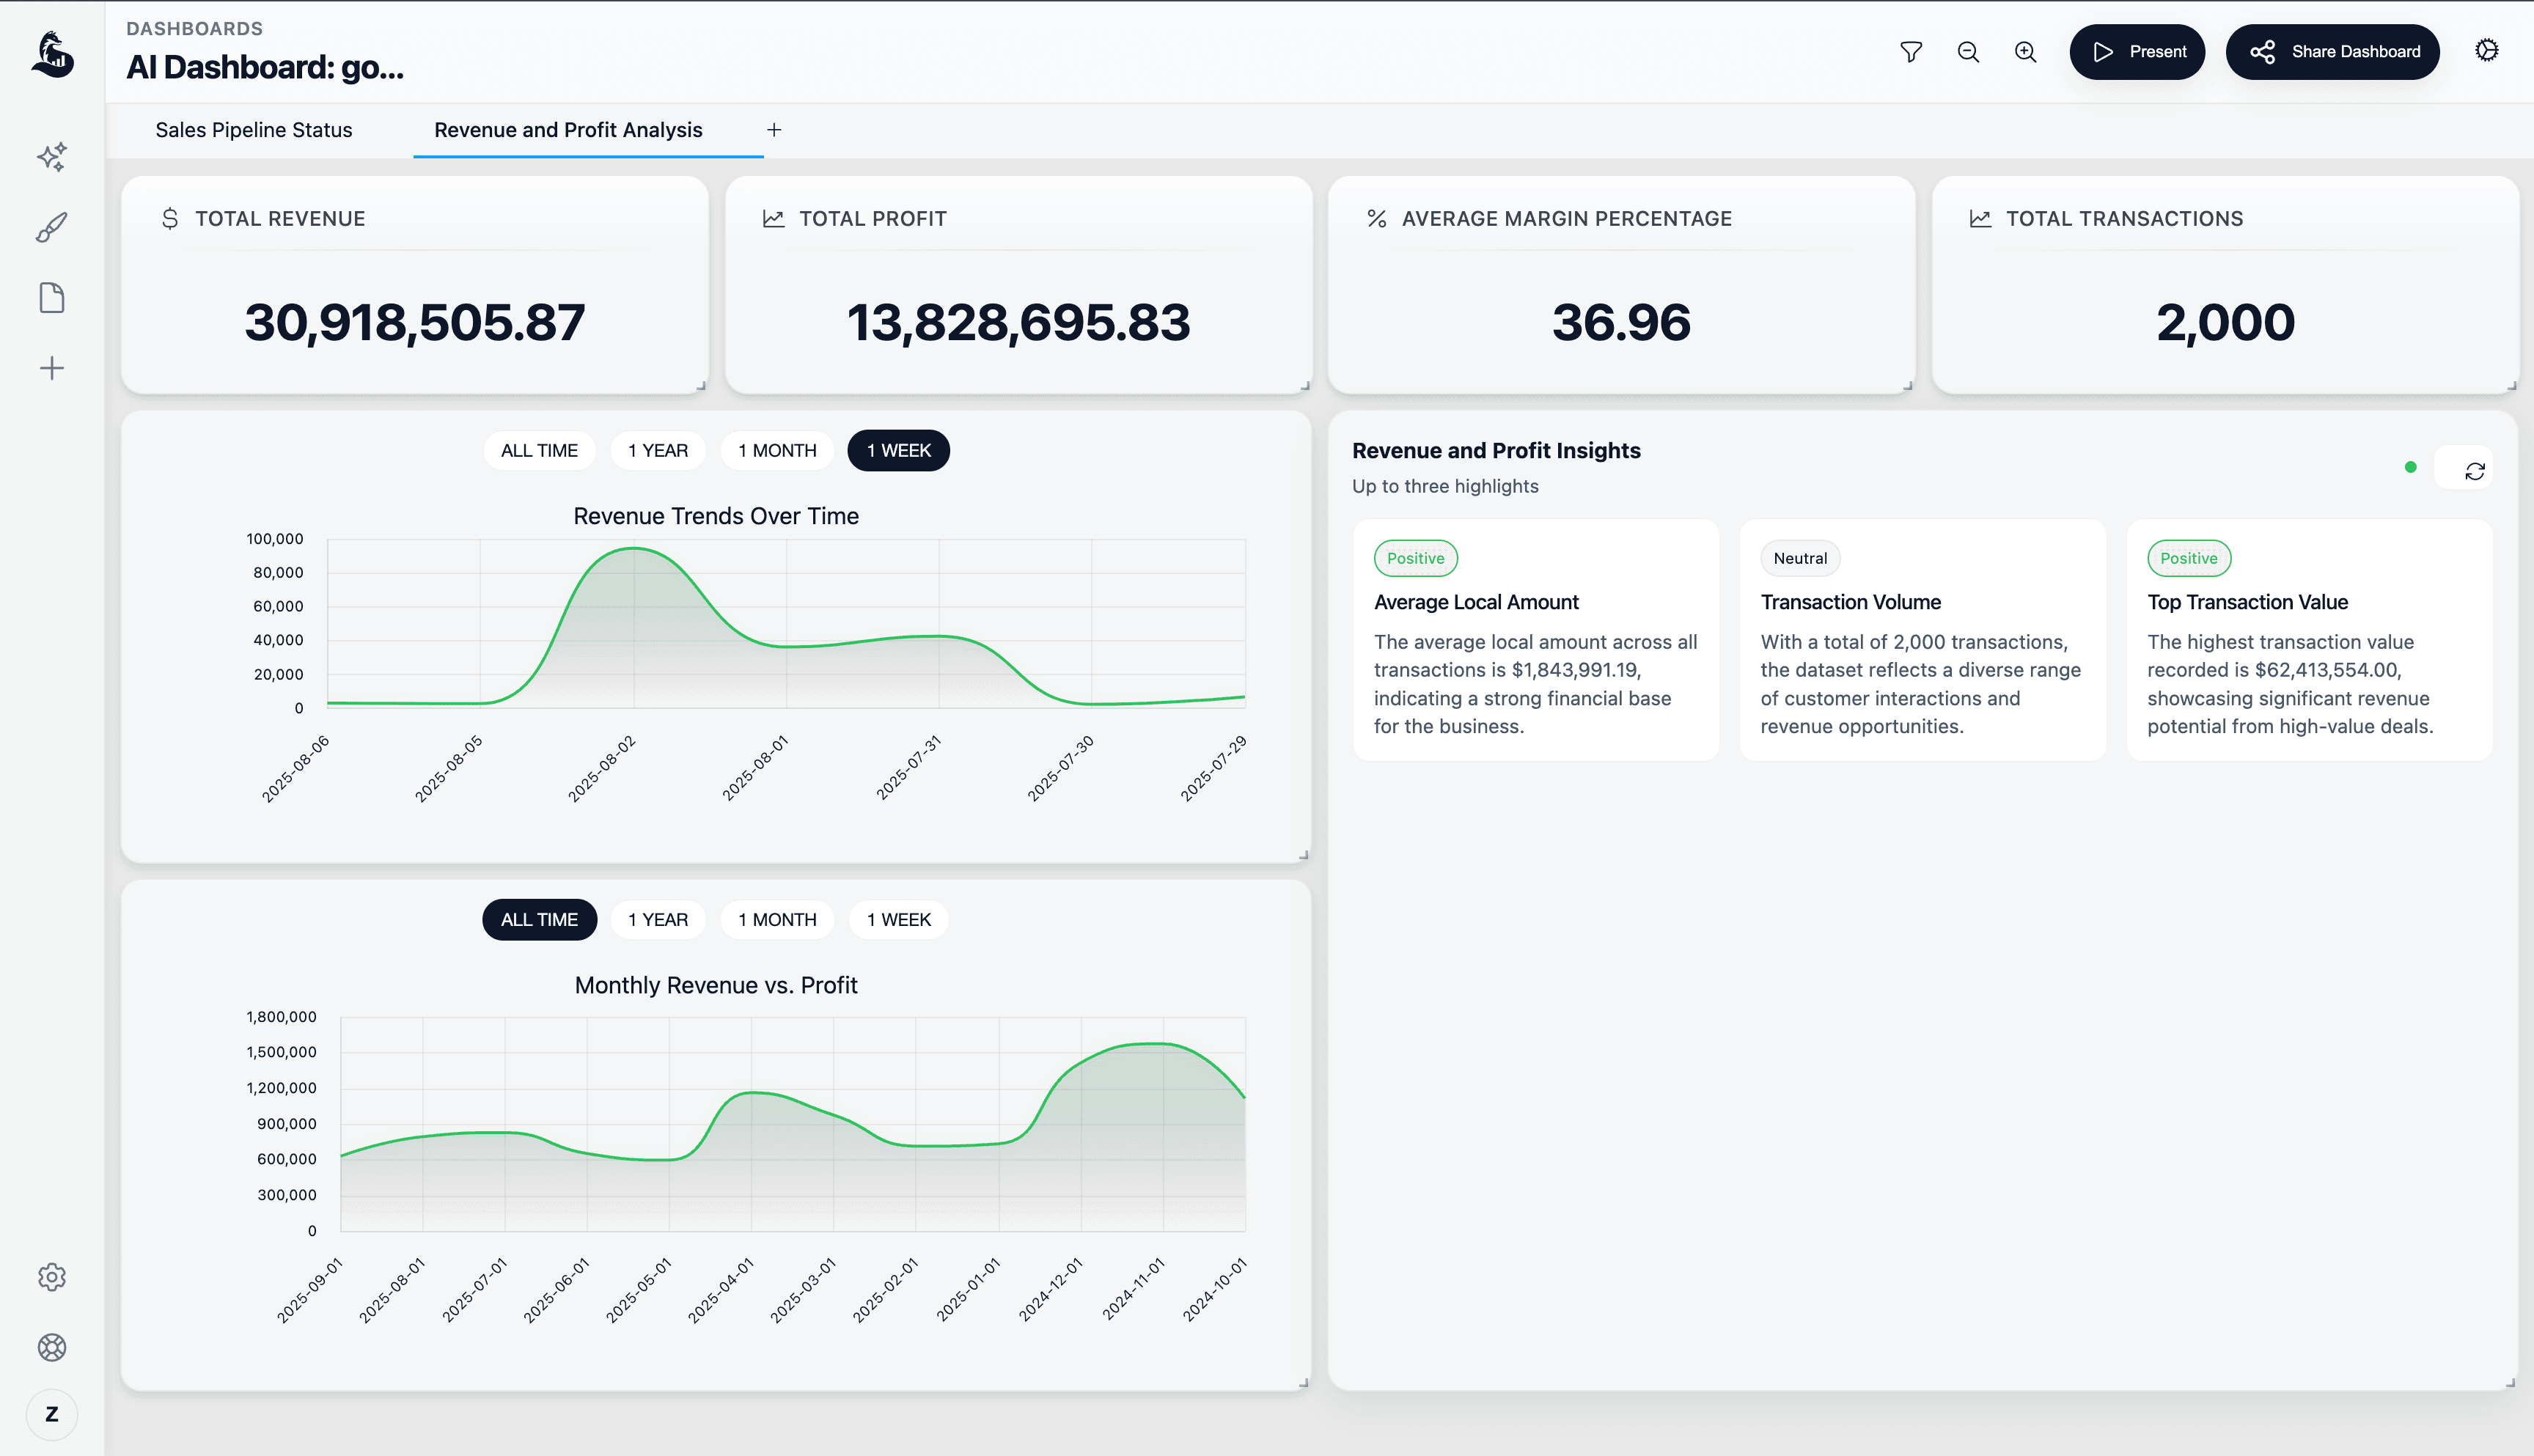
Track ARR, retention, pipeline coverage, and expansion in one live dashboard built for weekly exec reviews.

RevenueDashboardWeb
Revenue Performance Dashboard preview
Open in new tab

Explore every slide without leaving the page.

What this dashboard covers

01

Executive summary

ARR, growth %, churn, expansion, and NRR in a single row of KPIs.

02

Retention + expansion

Logo/seat churn, upsell, cross-sell, and cohort retention trends.

03

Pipeline health

Coverage vs. quota by segment, stage aging, and win rates.

04

Drilldowns

Breakouts by product, region, and AE with filters you can share.

About this template

This dashboard is designed for weekly revenue reviews. It keeps leadership, RevOps, and finance aligned on the same set of metrics without wrangling slides or exports.

What you get

  • Live tiles for ARR, NRR, churn, expansion, and new business.
  • Pipeline coverage vs. quota with stage-level drilldowns and aging.
  • Cohort retention and expansion views for fast pattern-spotting.
  • Filters for product, segment, region, owner, and customer lifecycle.

How to use it

  1. Use the prompt on this page to generate a website-backed dashboard in ML Clever.
  2. Adapt the sections to your source of truth, such as Snowflake, BigQuery, Salesforce, HubSpot, or CSV.
  3. Add commentary blocks to explain risks, deltas, and next actions for the review audience.

Good to know

  • The preview link shows a read-only example of the dashboard direction.
  • You can add commentary blocks to highlight deltas or risks each week.
  • Need additional metrics? Duplicate any chart and point it to your own measures.