Turn metrics into a clear report.
Use your files and notes to create a performance report with comparisons, findings, and next steps. Edit the text, tables, charts, and visual design before sharing.
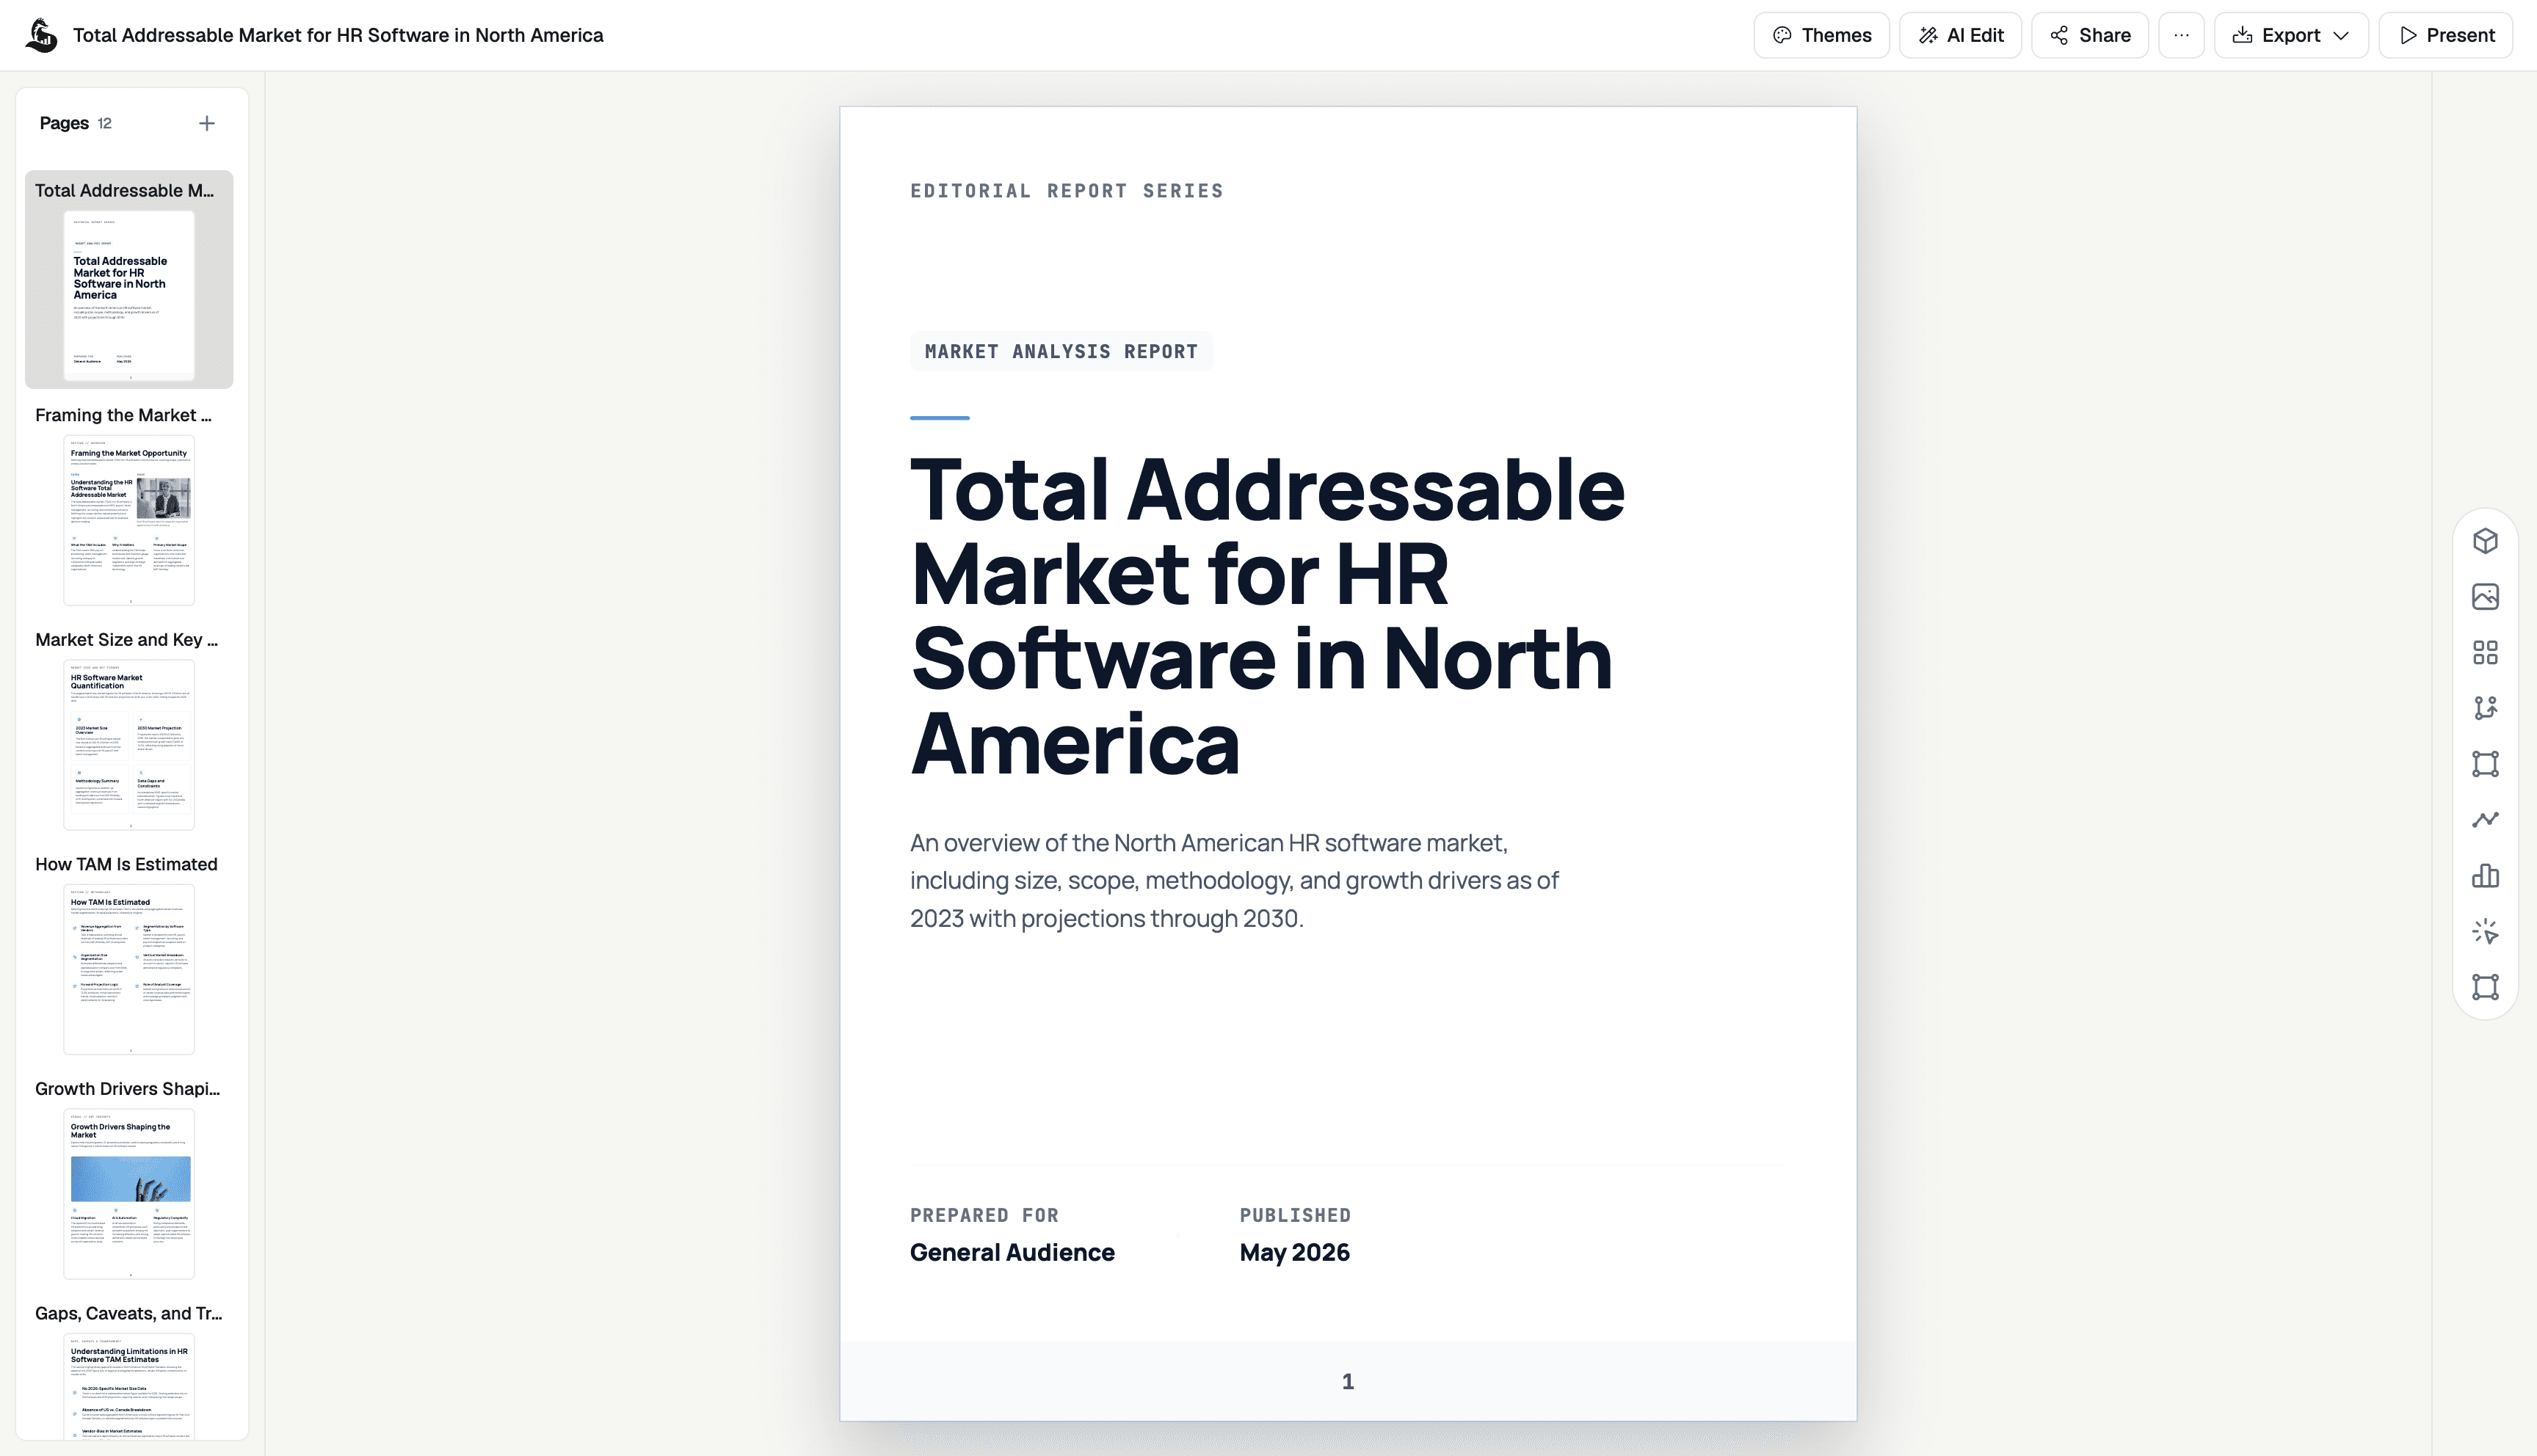
In development
Looking to explain your business results? Create a visual report or presentation with key figures, charts, and commentary from your supplied data.
Use your files and notes to create a performance report with comparisons, findings, and next steps. Edit the text, tables, charts, and visual design before sharing.
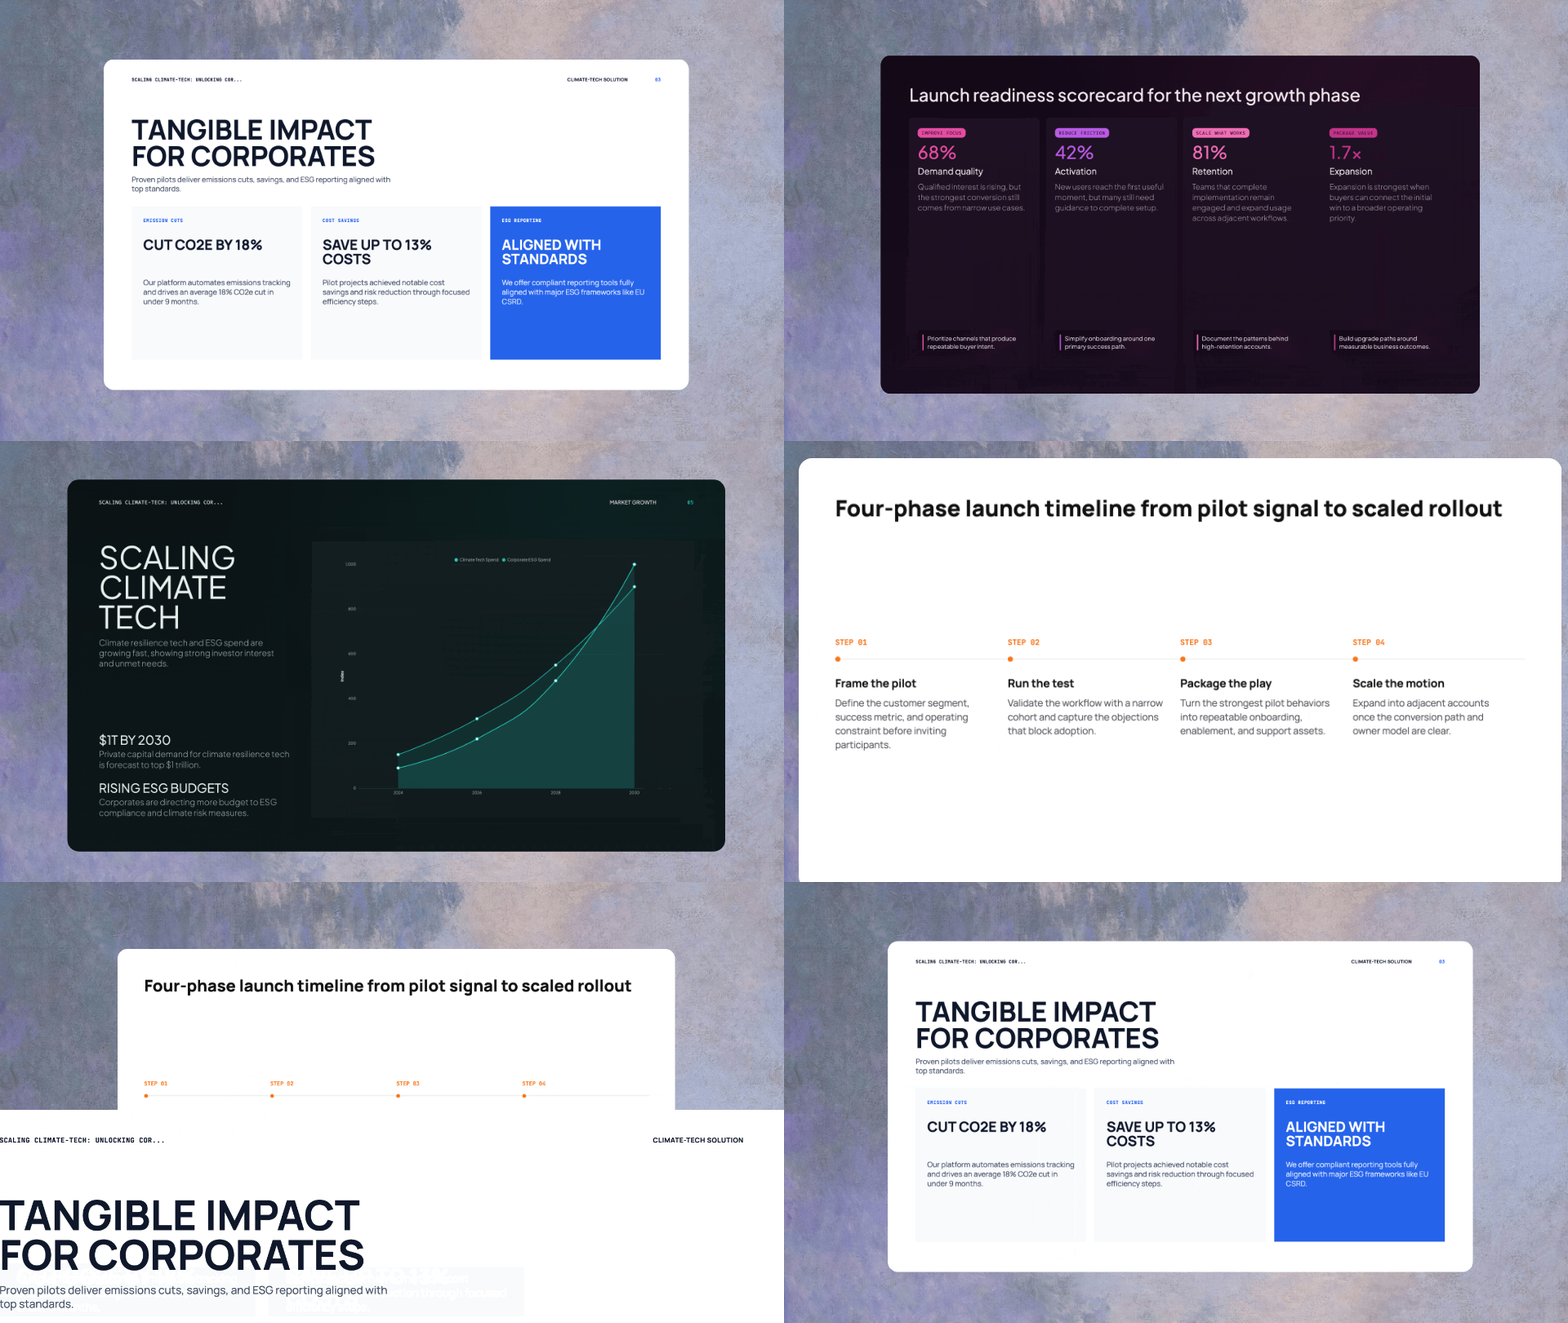
Turn a business brief or research topic into a structured presentation. Refine the outline, edit the slides, and choose a theme that suits your audience.
New dashboard creation is currently unavailable while the builder remains in development. Documents, slides, and chat are available.
Yes. Sign in to your existing ML Clever workspace to access your saved projects. Contact support if you need help finding one.
There is no announced return date. Choose ML Clever for its currently available document, presentation, and chat workflows.