Custom Dashboard
Build interactive dashboards for your data and machine learning models. Choose from 40+ visualization components, arrange them with drag-and-drop tools, or let AI generate optimal layouts for you.
Key Features
Documentation
AI Dashboard Generation
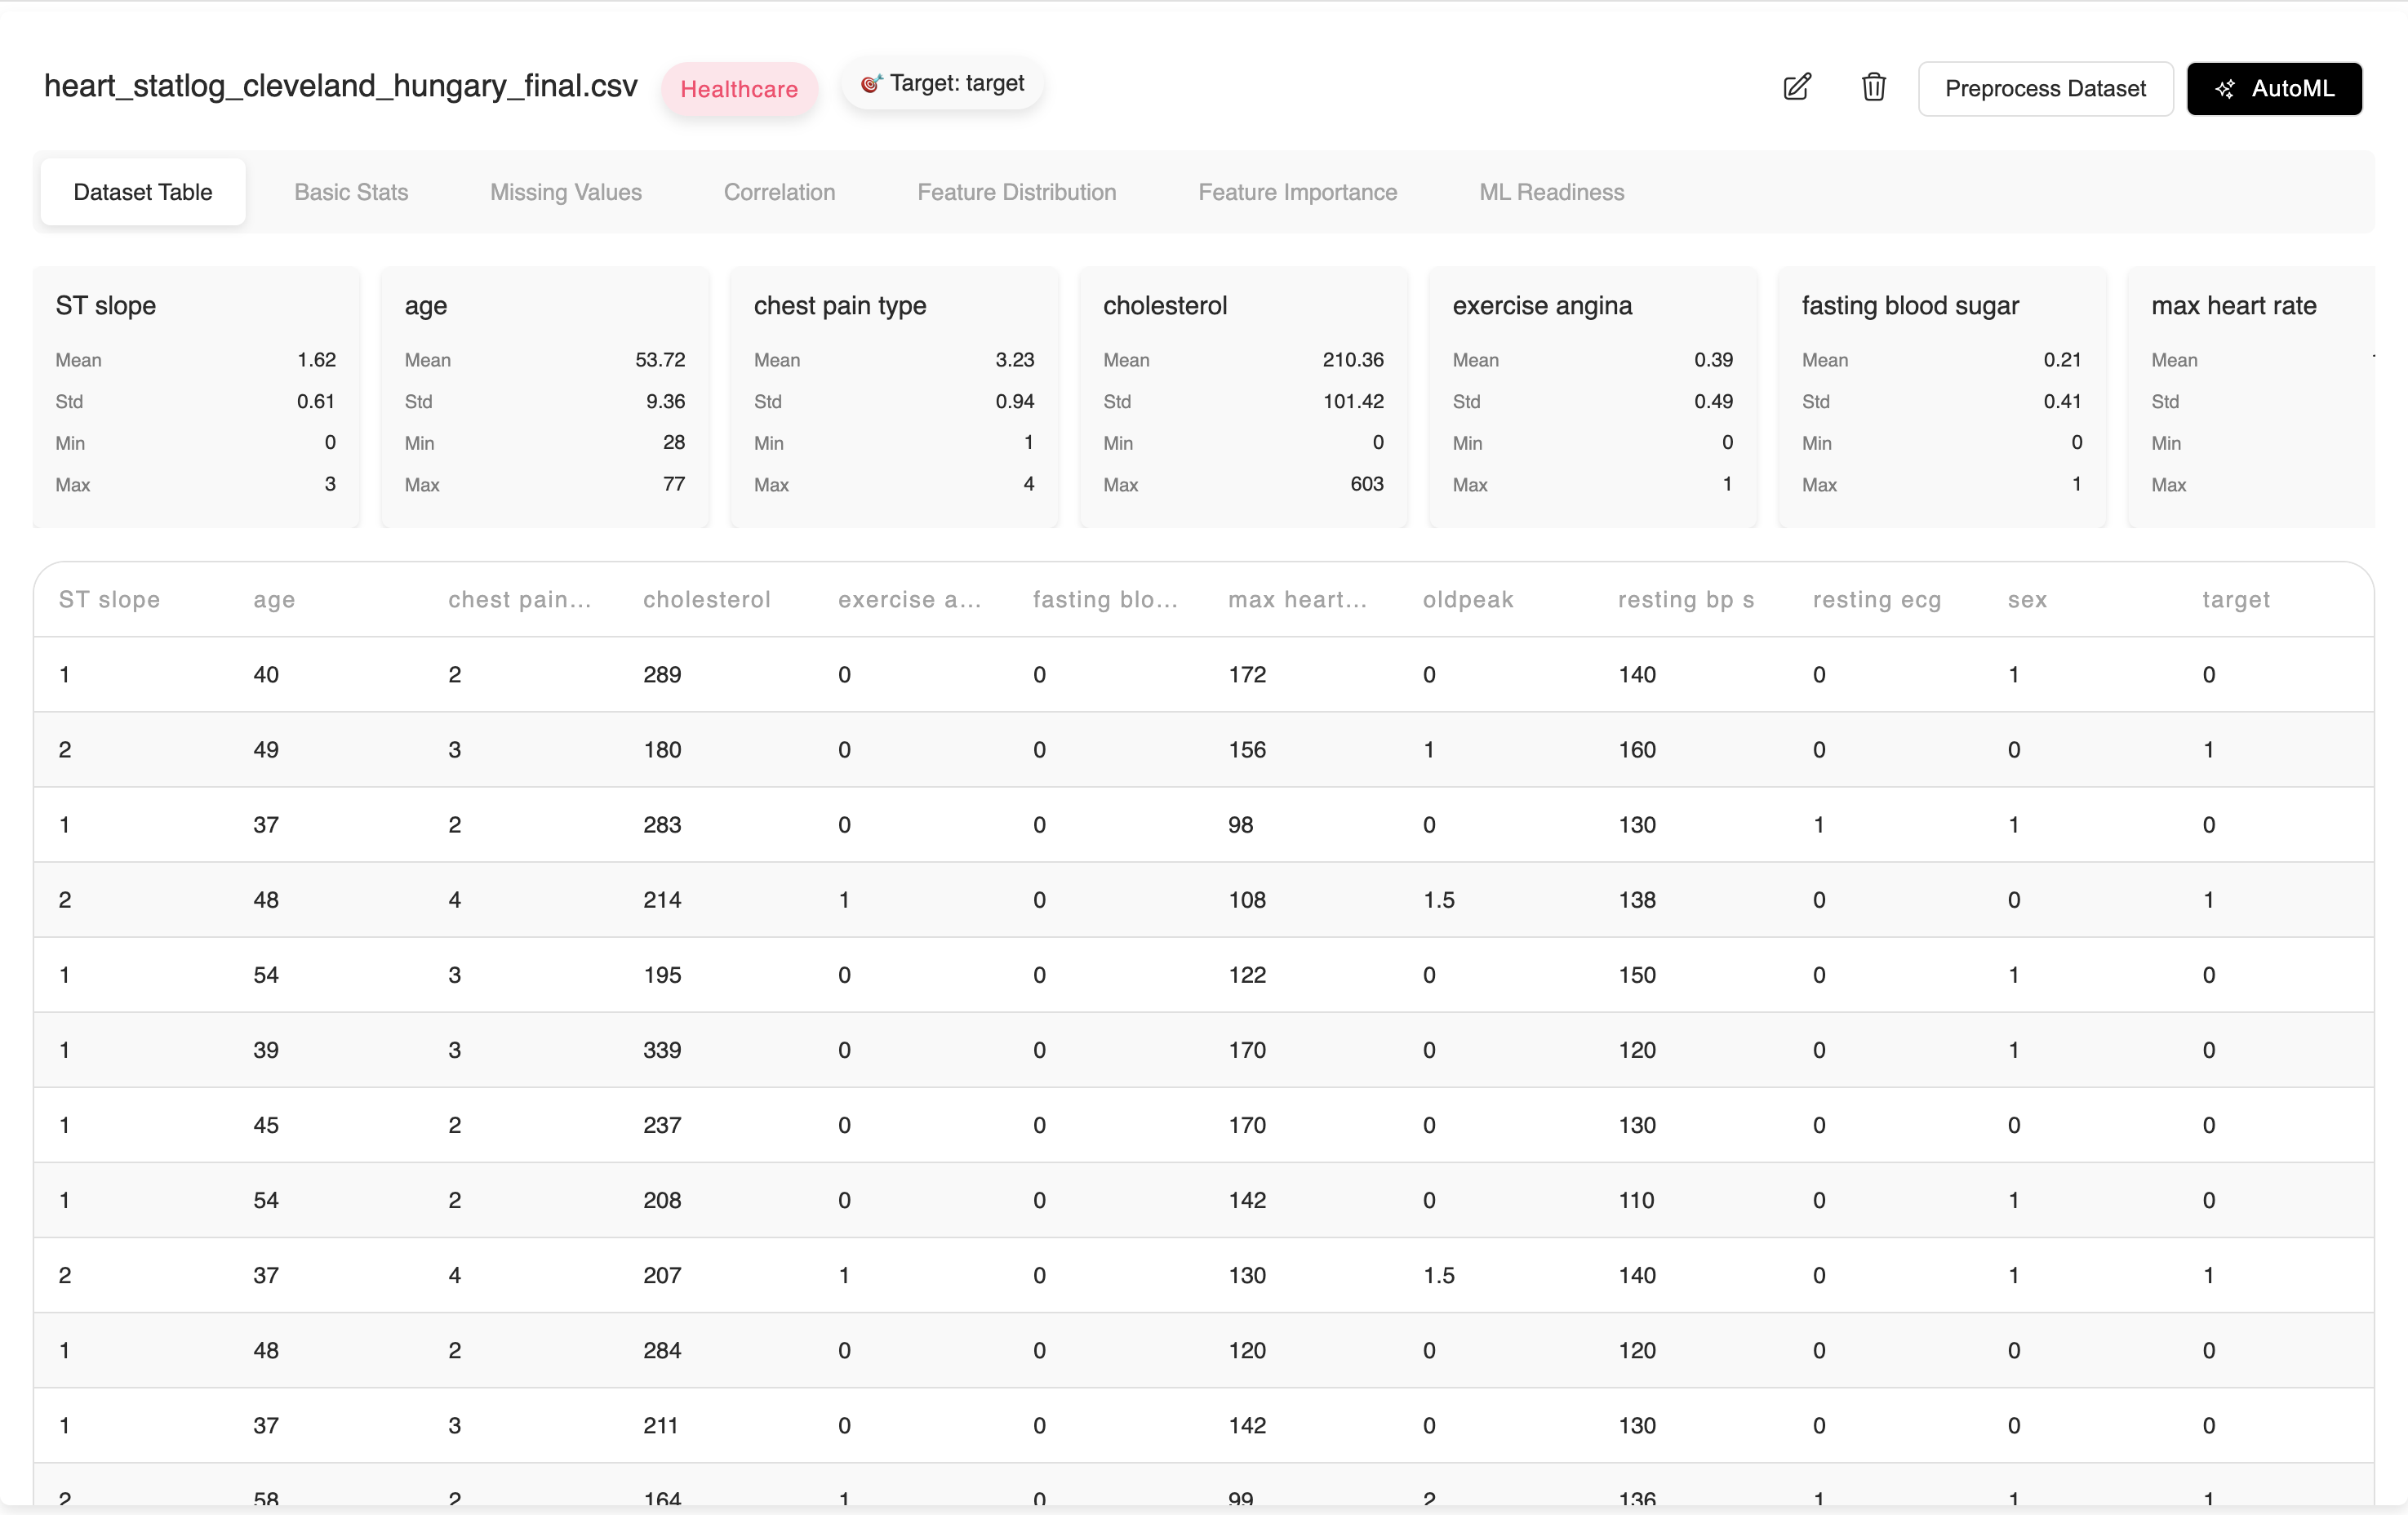
Transform your data into comprehensive dashboards with one click.
Learn more →Smart Data Visualization
Automatically generate KPI cards, charts, and visualizations that highlight key insights.
Learn more →Dashboard Customization
Personalize layouts with intuitive drag-and-drop interface and branding options.
Learn more →Secure Dashboard Sharing
Share insights with flexible access controls and public or private options.
Learn more →Getting Started with Custom Dashboard
ML Clever dashboards make it easy to visualize your datasets and machine learning models. Whether you want to create custom visualizations with drag-and-drop tools or use AI-generated layouts, our platform provides both standard components like charts and tables, as well as specialized ML components for model analysis and monitoring.
Pro Tip: Start with our pre-built dashboard templates for common ML workflows, then customize them to fit your specific needs. This provides the fastest way to get meaningful visualizations for your data and models.